
What 2025 Data is Teaching Us About Youth Activity Center Growth
February 25, 2026
New student pipelines shifted in 2025 — but revenue still grew. Here’s what the data reveals, plus how top gymnastics, swim, cheer, and dance centers are adapting heading into 2026.
Most youth activity centers exist to make an impact, not chase profit. But with tight margins, even small changes in enrollment, customer mix, or leadership strategy can meaningfully affect the bottom line.
That’s why trends and benchmarks matter. They help you spot what’s changing, set clearer goals, and pinpoint where to double down or adjust before challenges hit.
How We Analyzed the Youth Activity Center Market
As a class management software, iClassPro® processes data for many types of class-based businesses. To gather practical benchmarks and trend insights, we analyzed anonymized user data across four of our high-volume youth activity center categories:
What Data We Looked At (Business KPIs & Core Industry Metrics)
We reviewed 2024–2025 performance across five KPI categories to highlight what’s changing and where growth is coming from. Here’s the full KPI list, organized by category:
- Revenue & Monetization - Gross Annual Revenue, Annual Revenue Per Student (USD), Monthly Revenue Per Student (Average by industry), % Change in Revenue Per Student
- Enrollment & Acquisition - First-Time Student Acquisition, Number of Paid (Active) Enrollments, Average Active Students per Month (by Industry)
- Trials & Conversions - Trial Conversion Rates, % Change in # of Trial Enrollments Offered
- Retention, Churn & Lifetime Value - Average Student Paid Tenure (Months), Average Monthly Churn Rates, Student Lifetime Value (USD, Average by Industry Revenue / Tenure)
- Student Demographics - % of New Students By Age (Entry Ages 0-13, by Industry), % of Churned Students By Age (Exit Ages 0-13, by Industry)
- Operations & Capacity - Average Makeup Tokens Created per Month (Used vs Unused), % of Makeup Tokens Redeemed (by Industry), Makeup Tokens to Student Ratio (by Industry),Instructor/Student Ratio
Find Helpful Industry Benchmarks for Gym, Swim, Cheer & Dance
Behind the scenes, this study includes dozens of data points — but we’ve translated them into clear trends and practical takeaways.
In summary, running a youth activity center in 2025 didn’t necessarily feel harder — but it felt a little different. Fewer new students walking in the door. Higher expectations from families. And more pressure to make the right calls with limited time and staff.
Our research will help you get a clearer picture of what businesses like yours are probably already feeling in real time.
We’ll break down our four key findings then span all four industries in this article.
We’ve also compiled more industry-specific metrics that you can use to benchmark your performance against real business data captured by iClassPro.
Access your industry’s targeted metrics report below:
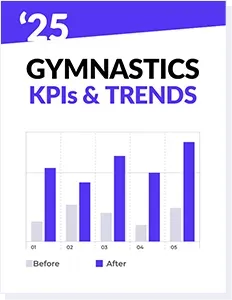
2025 Gymnastics Center KPIs & Trends
Explore key metrics based on anonymized data from qualifying gymnastics centers using iClassPro throughout 2024-2025.
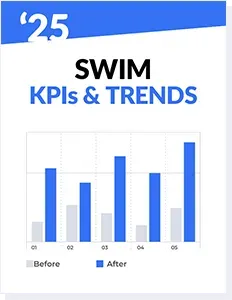
2025 Swim School KPIs & Trends
Explore key metrics based on anonymized data from qualifying swim schools using iClassPro throughout 2024-2025.
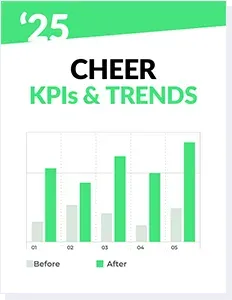
2025 Cheer Gym KPIs & Trends
Explore key metrics based on anonymized data from qualifying cheerleading gyms using iClassPro throughout 2024-2025.
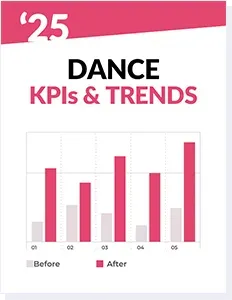
2025 Dance Studio KPIs & Trends
Explore key metrics based on anonymized data from qualifying dance studios using iClassPro throughout 2024-2025.
Our Industry Benchmarks Revealed 4 Clear Market Trends in 2025
If you’re looking for a snapshot, this is it!
- Revenue increased — even as fewer new students entered the funnel.
- Paid enrollments dipped slightly, but spend per student rose.
- Trial conversion stayed strong, but fewer trials took place.
- Your churn timing — not just churn rate — is going to be a major growth factor.

Trend #1: Revenue is Rising While the New Student Pipeline is Shrinking
A look at the stats behind this trend:
- Gross revenue increased across all four industries: +4.6% to +11.9%
- First-time student acquisitions decreased across all four industries: -11.3% to -16.1%
What this means for youth activity centers:
Class-based businesses are making more money overall, but with fewer new students. The growth is driven by existing families through stronger retention, higher spend per student, and expanded participation, rather than a steady influx of new enrollments.
Impacts to your gym, swim, cheer or dance business:
- Gymnastics: Followed the overall trend without ranking highest or lowest in either metric. Performance also appeared more consistent than some categories.
- Swim: Saw the lowest revenue growth, but the smallest decline in first-time students, signaling a comparatively steadier new-student pipeline.
- Dance: Posted the highest revenue growth, suggesting strong monetization of current students (e.g., pricing increases, program expansion, increased class participation).
- Cheer: Showed the most variability in both revenue growth and first-time student acquisition—indicating results vary more between gyms than other categories.
Actionable Takeaway:
If your numbers mirror this trend, you should think about bolstering your retention and promotions strategies. This will help you maintain revenue while building the top of your pipeline.

Trend #2: Number of Paid Enrollments Slipped Slightly (But Spend Per Student Increased)
A look at the stats behind this trend:
- Paid enrollments declined across all four categories: -2.70% to -5.20%
- Average spend per enrolled student increased: +8.8% to +14.3%
What this means for youth activity centers:
Overall enrollment volume softened a bit—but the students who did enroll spent more. That increase in spend per student likely helped offset the enrollment decline and contributed to overall revenue growth. This trend is worth watching: on its own, a small dip may be temporary, but if it continues, retention and satisfaction become the biggest levers for sustainable growth.
Impacts to your gym, swim, cheer or dance business:
- Gymnastics: Showed the most consistent trend—and also the largest enrollment decline (up to -5.20%).
- Cheer: Again showed the most variability in enrollment change, indicating performance differs widely by gym.
- Swim: Followed the overall trend (no specific high/low).
- Dance: Followed the overall trend (no specific high/low).
Actionable Takeaway:
If enrollments are slipping but spend per student is rising, now’s the time to protect both momentum and margin.

Trend #3: Trial Conversion Stayed Steady, But Numbers Shrank
A look at the stats behind this trend:
- Trials offered decreased (2025 vs. 2024) across all four categories: -4.33% to -7.69%
- Trial-to-enrollment conversion held steady across industries: ~60% for trial students with no previous active enrollments
What this means for youth activity centers:
The issue isn’t that trials are converting worse—it’s that fewer trials are happening in the first place. With conversion rates remaining stable, the biggest enrollment opportunity is likely increasing the volume of trial participants, not overhauling the trial experience (though optimization still helps). It’s unclear whether organizations offered fewer trial opportunities or if overall interest declined—but either way, the result is the same: a smaller pipeline feeding new enrollments.
Impacts your gym, swim, cheer or dance business:
- Gymnastics: Performed at the stronger end of conversion at ~60%.
- Swim: Performed at the stronger end of conversion at ~60% and saw the smallest decrease in trials at –4.33%.
- Cheer: Performed at the lower end of conversion at ~54%.
- Dance: Performed at the lower end of conversion at ~54% and experienced the highest decrease in trial numbers at –7.69%.
Actionable Takeaway:
If you want to grow enrollments, focus on driving more trials while keeping conversions strong.

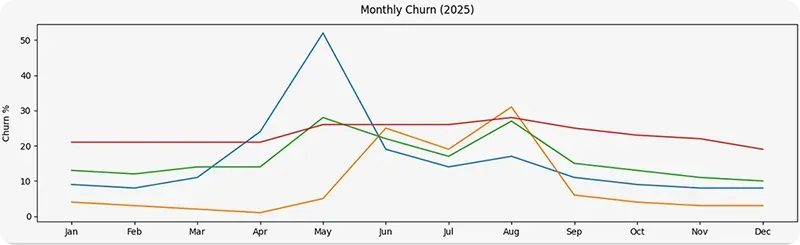
Trend #4: Churn is the Silent Growth Killer
When new students are harder to acquire and revenue growth depends more on returning families, churn becomes a key predictor of performance. Seasonal churn spikes can create cash-flow instability, which increases risk during unexpected events (repairs, closures, slow months).
A look at the stats behind this trend:
- Churn is calculated at the rate at which actively enrolled students drop out of paid enrollments (either temporarily or altogether)
- Average monthly churn across the four industries: 15.39%-23.61%
What this means for youth activity centers:
If your growth is coming from retention and increased spend per student, churn quietly undermines both. Even when revenue looks strong, churn can signal future softness—because it reduces your active base, limits upsell potential, and forces you to replace students faster just to stay even. The most resilient centers aren’t the ones with zero churn—they’re the ones that anticipate churn cycles and put systems in place to reduce and smooth it.
Impacts your gym, swim, cheer or dance business:
- Cheer: Experienced the highest single-month churn spike, reaching ~50% in May (post-competition season).
- Swim: Showed the most stable churn pattern with fewer peaks/troughs but the highest average monthly churn around ~23%.
- Dance: Had the lowest average churn overall at roughly ~15%, but churn surged in summer (June–August)—more than tripling the lowest monthly churn rate by late summer. From September–May, churn stayed below ~10% on average.
- Gymnastics: Saw two key churn peaks in May and August (start of summer + back-to-school), rising to ~20–22%, with a steadier year-round churn around ~16%.
Actionable Takeaway:
To protect revenue and reduce risk, build churn prevention around the moments churn is most likely.
The Youth Activity Center Growth Playbook for 2026
These four trends work together: a shrinking pipeline + steady conversion + rising spend + seasonal churn. That combination rewards centers that treat retention and acquisition like a high maintenance system. The recommendations below prioritize the fastest growth levers to strengthen enrollment, protect revenue, and reduce risk.
1) Strengthen retention (your most reliable growth lever)
- Maximize re-enrollment and reduce churn points (schedule friction, billing surprises, unclear progress).
- Focus on attendance consistency and proactive outreach to at-risk families.
2) Reduce churn with seasonal planning
- Identify your “churn season” and build campaigns before peak drop-off months (summer, back-to-school, post-season).
- Offer flexible options like short-term discounts, schedule swaps, or alternative enrollment opportunities to prevent cancellations.
3) Increase revenue per student
- Add value-driven pathways: levels, clinics, workshops, intensives, camps, private lessons, or multi-class incentives.
- Position upgrades as progress (“next step” recommendations), not just add-ons.
4) Rebuild the top of funnel (trials, intros, and first-timers)
- Promote trials consistently through ads, email/text, social, and local partnerships.
- Streamline trial booking: fewer steps, faster scheduling, and minimal wait time.
5) Protect conversion with tight follow-up and tracking
- Track the full flow: trials booked → trials completed→ converted enrollments.
- Prioritize follow-ups and clarify the “next step” with a suggested enrollment.

Planning for the Future with Real Data Insights (Not Guesswork)
If there’s one theme that stands out across the youth activity market, it’s this: growth is still possible, but it’s shifting and you need a clear strategy.
We didn't find signs of industries in decline. We found signals that the rules are changing. Going into 2026, the organizations that thrive won’t necessarily be focused solely on chasing more students.
The best part? These trends aren’t just theory — they’re measurable. And when you know what’s happening in your industry, you can set goals, forecast revenue, and build a plan that’s grounded in reality.
If you’re ready to dig into the benchmarks specific to your business type, download your industry’s report to see how your category performed — and how your team can turn these trends into practical action steps for 2026.
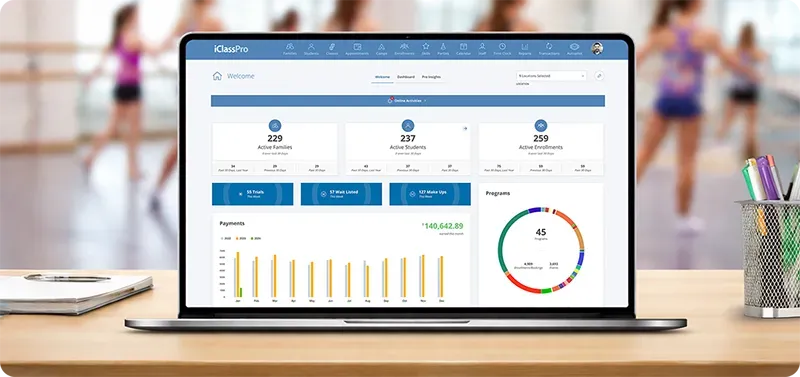
If you’re ready to see what your children's activity center can do when it’s got quality software and data on it’s side, we’ve got you covered!
Our Methodology: How the Data Was Studied
To be included in the data for this study, the iClassPro accounts in our aggregated data must have been actively using the software over all of 2024 and 2025 with a minimum volume of enrollment and transaction related data.
Data Privacy and Confidentiality
All business data used in this study was aggregated and anonymized. No individual organization can be identified from the benchmarks provided.
Start planning with confidence!
To request access to our original research and methodology, please email
marketing@iclasspro.com.
About the Authors

Brittany Houser, Sr. Marketing Specialist
Brittany is a seasoned marketing specialist with over 12 years of experience bridging the gap between technology and youth programs. With a background in Marketing & Logistics Management and a career built around supporting class and camp organizations, she blends strategic insight with a genuine passion for helping teams thrive.

Jeremy Crumpton, Data Analyst
Jeremy untangles complex data and transforms it into actionable insights. As our Data Analyst, he turns intricate information into clear, meaningful reporting that empowers both our customers and internal teams to make confident, data-driven decisions. He was the powerhouse behind our Pro Insights feature, bringing clarity, strategy, and measurable impact to the way we use data every day.