Embedded Data Visualizations
with Pro Insights Dashboard
 

Make Data-Driven Decisions with Confidence

Empower owners and managers to make decisions that drive enrollment, boost retention, and maximize profitability. Transform your everyday business data into actionable insights—without spreadsheets, coding, or consultants—using built-in analytics and clear data visualizations. 

Dashboard displaying analytics

What is Pro Insights by iClassPro?

Your Built-In Analytics Dashboard for Smart Decision Making 

Pro Insights is an integrated analytics dashboard built directly into your iClassPro Office Portal, designed to simplify how you understand your business performance. Available exclusively with the Premium Plan, it delivers professional-level data insights, visualizations, and analytics, all within a single, intuitive view.


This powerful, embedded dashboard gives you access to a complete suite of business intelligence reports that help you track conversions, retention, enrollment trends, financial data and more. You can easily filter, drill into, and export data visualization charts that make complex information easy to interpret and share with your team.

Cards with instructor portraits and swim class details

Best of all, you don’t need to be a data expert to use it. With simple point, click, and export functionality, Pro Insights turns your day-to-day operations data into actionable intelligence, giving you a complete view of your business performance at a glance.


From identifying enrollment spikes to analyzing program profitability, Pro Insights helps you move beyond gut instinct and make strategic, data-driven choices that strengthen your business from the inside out. 

Already an iClassPro customer and ready to see your data come to life?
Explore the key performance indicators you can unlock with Pro Insights.

Why Pro Insights Matters for Your Gym, School, or Studio

When you’re running your business, time is precious and decisions can’t wait. Pro Insights takes the guesswork out of managing your operations by turning your existing data into easy-to-read, interactive visuals.

With Pro Insights, you can: 

A black and white drawing of two arrows pointing in opposite directions on a white background.

Describe some quality or feature of the company. Write a short paragraph about it and choose an appropriate icon.

Short title

Hand selecting the green checkmark icon to confirm a choice.

Make Smarter Decisions

Instantly see what’s working in your programs, classes, or locations with built-in analytics designed to highlight trends and provide you with marketing insights and opportunities.

Three people with a star icon, indicating a highly rated team.

Boost Retention and Engagement

Track student retention data and understand which programs and classes keep families coming back.

Bar graph with increasing colored bars, and an upward trending yellow arrow.

Monitor Enrollment Trends

Identify when, where, and why your enrollments peak to improve scheduling, staffing, and marketing strategies.

Magnifying glass over a bar graph, with two gears.

Discover Financial Trends and Insights

Stay on top of your business health with real-time charts that help you understand revenue streams and forecast growth.

Hand holding a pink gear with a dollar sign.

Save Time and Money

No need to hire a consultant to build custom reports! Pro Insights automatically gathers key performance data into a user-friendly format.

Two people reviewing documents, with two gold stars overhead.

Collaborate Confidently

Export and share your reports and data visualization charts with staff or partners to align your team around measurable goals.

A black and white drawing of two arrows pointing in opposite directions on a white background.

Describe some quality or feature of the company. Write a short paragraph about it and choose an appropriate icon.

Short title

Whether you’re evaluating a new class offering, measuring instructor performance, or planning your next marketing campaign, Pro Insights gives you the information you need to move forward with confidence. 

Key Metrics to Measure What Matters Most

Monitor your business health with essential KPIs

Pro Insights lets you monitor key performance indicators in one embedded dashboard, giving you a complete picture of your business health. Each metric is designed to help you understand trends, uncover opportunities, and make smarter decisions based on real-time data insights. Here’s what you’ll find: 

Woman using a laptop, viewing a spreadsheet and data charts on the screen.

Occupancy Tracking

Monitor class capacity and utilization across programs to see which time slots or instructors are performing best. Easily identify underfilled classes and optimize your schedule to boost efficiency and profitability. 

Net Student & Family Gain

Track overall growth trends by comparing new enrollments against drops. Use this data to evaluate the impact of seasonal campaigns or retention initiatives and adjust strategies proactively.

Woman using a laptop, viewing a spreadsheet and data charts on the screen.

Student Age Demographics

Understand your audience in greater depth with age-based data visualizations. Tailor your programming, marketing efforts, and future class offerings to align with your most engaged demographics.

Financial Trends & Insights

Access real-time data visualizations that reveal your business’s financial health at a glance. From tuition revenue to payment patterns, Pro Insights keeps you informed so you can make confident budgeting and investment decisions.

Woman using a laptop, viewing a spreadsheet and data charts on the screen.
A black and white drawing of two arrows pointing in opposite directions on a white background.

Describe some quality or feature of the company. Write a short paragraph about it and choose an appropriate icon.

Short title

Family under a roof with a shield and dollar sign, representing financial security.

Average Family Spend

Gain visibility into how much each family contributes to your revenue. This insight helps you understand customer value, target upselling opportunities, and fine-tune pricing structures.

Family under a roof with a shield and dollar sign, representing financial security.

Retention & Conversion Analytics

Identify what’s working and where there’s room to improve by analyzing student retention data and trial conversion rates. See which programs inspire long-term engagement and where marketing insights and adjustments could increase sign-ups.

Family under a roof with a shield and dollar sign, representing financial security.

Skill Evaluations

Measure student progress and program effectiveness with data-backed visuals. Understand how skill development correlates with retention and make informed decisions about curriculum improvements or staff training.

Family under a roof with a shield and dollar sign, representing financial security.

Enrollment Duration

See how long students remain enrolled in your programs and what factors influence their longevity. This metric helps you recognize patterns that lead to stronger retention and long-term student success.

Family under a roof with a shield and dollar sign, representing financial security.

Family Tenure

Track loyalty and long-term relationships to better understand your customer lifecycle. Use these insights to design targeted communications, loyalty programs, and retention campaigns that keep families coming back year after year.

Family under a roof with a shield and dollar sign, representing financial security.

Waitlisted Students

Manage demand by tracking waitlisted-only students and identifying capacity opportunities. Recognize popular classes at a glance and make smart staffing or scheduling decisions to meet your community’s needs.

All your key metrics in one place.
From occupancy and retention to financial trends and student progress, see exactly what drives your business all in a single, interactive dashboard. Turn insights in action.

The Proof Is in the Performance:  Insights That Fuel Growth

Reporting automation saves  6-8 hours weekly on average.  Source

Spend less time gathering data and more time acting on it with confidence. 

Data-driven organizations are   23  times more likely   to   acquire customers.  Source

Having a dashboard that translates raw numbers into meaningful trends is exactly what drives growth.

Businesses that use big data increase their profit by 8% on average.   Source

Turning data into insight is not just smart, it’s quantifiably profitable. 

Organizations that leverage customer behavioral insights outperform peers by 85% in sales growth and 25% in gross margin; they are 58% more likely to beat revenue goals!  Source

The difference between reactive management and insight-driven leadership can be huge. 

More than 80% of iClassPro Premium Plan users run at least one financial report weekly!

Our customers recognize value in monitoring their numbers, and Pro Insights makes that monitoring effortless and meaningful. 

FAQs

  • Who has access to Pro Insights?

    Available to Premium Plan users in the iClassPro Office Portal. One seat is included with the Premium Plan, with additional seats available for $19/month per seat. 

  • Do I need technical skills to use it?

    Not at all. The dashboard is designed for simplicity. No coding or advanced analytics experience is needed. Just point, click, and export to get the answers you need. 

  • Can I track financial and enrollment trends at the same time?

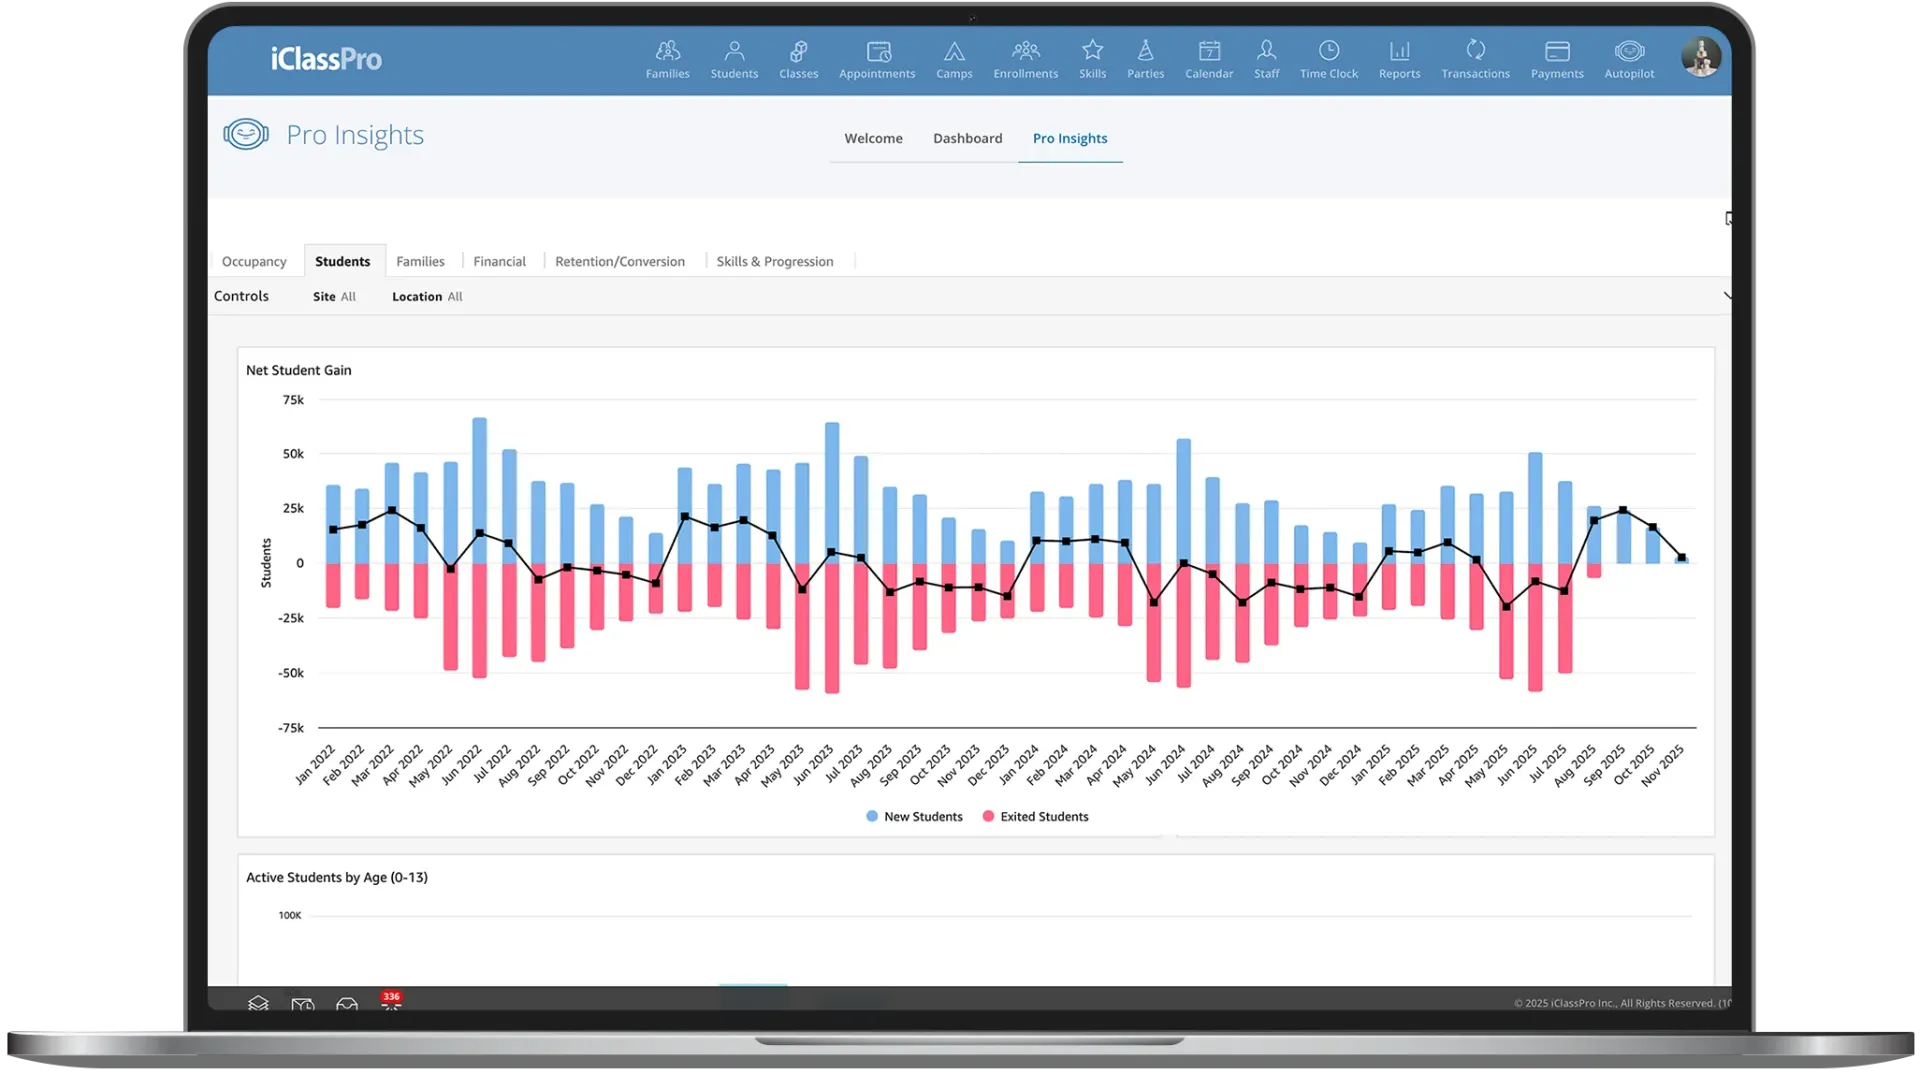
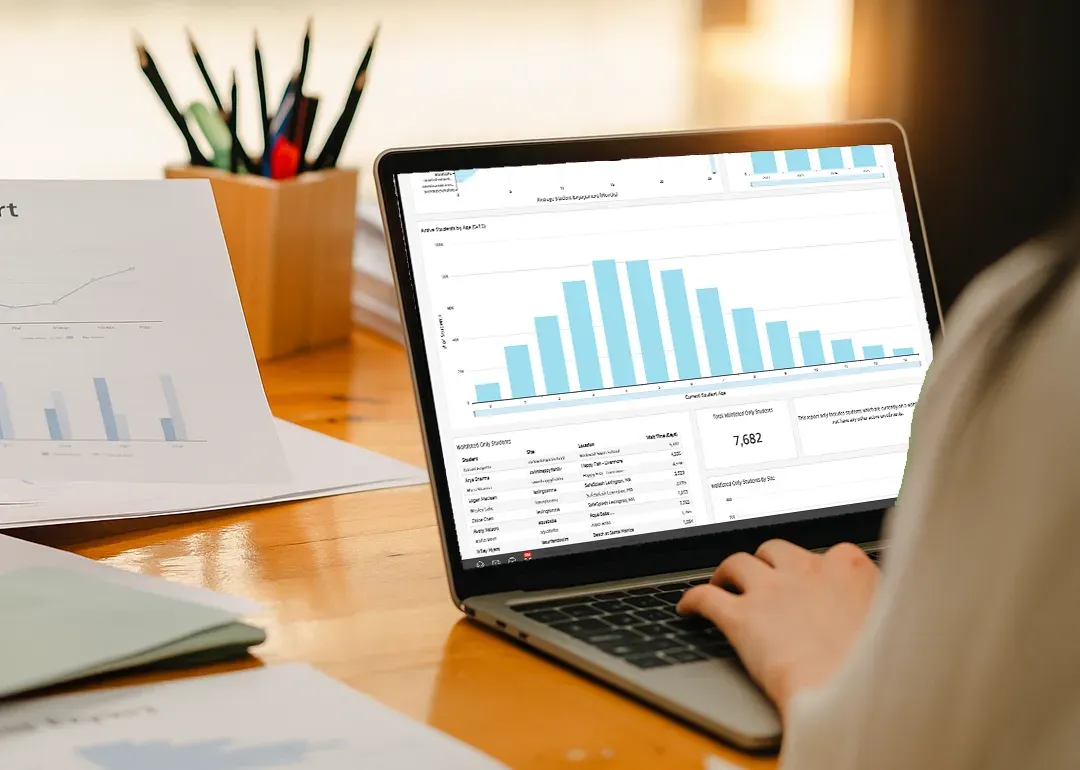
    Yes, the embedded dashboard combines operational and financial data into one unified view, helping you connect the dots between your revenue, programs, and student outcomes. 

  • Can I export charts and reports?

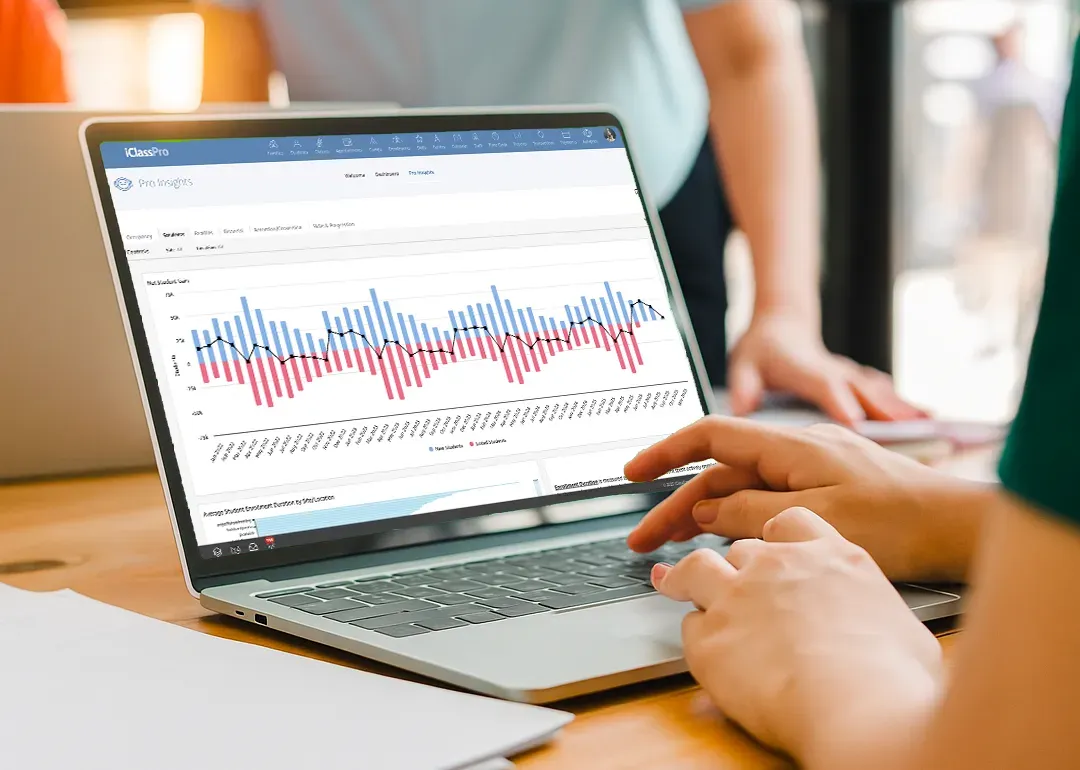
    Absolutely. Every chart, graph, and table can be exported and shared with your team, giving you the flexibility to collaborate, present findings, or save snapshots over time. 

  • Does Pro Insights track student retention data?

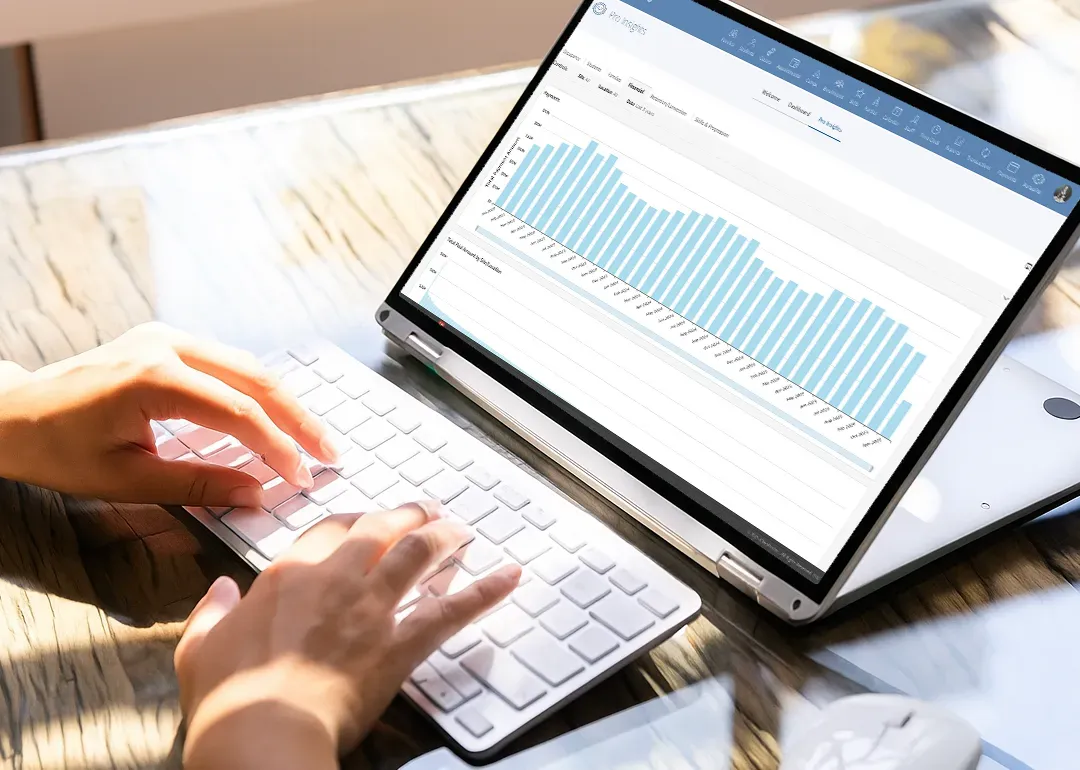
    Yes, Pro Insights makes it easy to monitor student retention, trial conversion, and enrollment trends and statistics so you can identify patterns and make proactive improvements to your programs.

Trello board with dollar sign, star, and color-coded cards.

See How Pro Insights Can Transform Your Business

Pro Insights gives you the clarity and control to lead your cheer gym, gymnastics club, swim school, multi sport organization or other children’s activity based business with confidence.

No Commitment

Already an iClassPro Customer?

Take a closer look at Pro Insights in action!

Not yet a customer?

Discover how iClassPro can simplify your operations and drive growth.

Already on Signature or Elite?

Upgrade Your Plan to Premium to Unlock Pro Insights.

No Commitment

If you are already on Premium or Enterprise, contact support@iclasspro.com